How ArmorIQ Observability connects the plan, the policy decision, and the execution in one record.
One agent request is never one action. “Validate this payroll run” becomes a plan → a policy check → a tool call → a model generation → another tool call → a final status. Six operations, three systems, one intent.
Your application logs record fragments of that. The tool logged something. The model provider has usage somewhere. The proxy wrote an access line. What none of them can tell you: which plan that tool call belonged to, which policy decision let it through, what the model actually cost, and why the request ended the way it did. Traditional observability treats the request as the unit of meaning. For agents, the unit of meaning is the plan and the plan is exactly what logs lose.
ArmorIQ Observability keeps it. Every agent request becomes an organization-scoped record of what the agent planned, which policies ran, which tools executed, where time went, and what failed. Here is how it works.
The data model: session → trace → span
The hierarchy is the whole idea. It keeps a long conversation readable without losing the detail of one decision.
Session: one continuous run or conversation
├── Trace: plan or turn A
│ ├── policy_call: allow, deny, hold, or ask
│ ├── span: tool call input, output, timing
│ ├── generation: model, tokens, estimated cost
│ └── event: note, warning, or error
└── Trace: plan or turn B
A session is one continuous agent run one payroll chat, one research task. A trace is one plan or logical turn inside it. A span is one operation inside the trace, and spans come in four kinds:
policy_call the enforcement record: which policy ran, the decision, the rule, the source, and the reason. This is the span that answers “why was this tool allowed or blocked.”
span a timed operation, usually a tool lifecycle: name, input, output, error, duration.
generation model usage as reported by the producer: model, input/output tokens, estimated cost, finish reason.
event a point-in-time note at info, warn, or error level. Retries, controlled failures, lifecycle changes.
You can hand someone a session and they can navigate down to the exact span where things went wrong or up from one span to the plan that caused it.
How the record gets made
The SDK lives in the agent process and maps framework callbacks to telemetry. When the model declares its tool calls, the SDK starts one trace for that plan. Each policy check, tool dispatch, tool result, and model generation lands as a span under the active trace. When the request finalizes success, failure, or client cancel the trace closes with a terminal status, exactly once.
Closed traces go to a shipper that batches them and sends authenticated batches every 5 seconds, up to 100 traces per POST. Network and server errors get three retries at 0.5, 1, and 2 seconds; client errors are logged and dropped. Delivery is best-effort and memory-based by design, and the whole telemetry path is fail-open: an observability failure never changes an allow or block result, and never touches the agent’s response.
Organization scope is set on the server, not by the agent. The SDK sends its API key; the backend verifies it and stamps that key’s organization on every trace, span, and session it writes. The agent cannot choose or spoof an org ID because it never sends one. On the read side, every dashboard query requires a valid login, membership in the organization, and audit permission and every query filters by that same org.
The dashboard polls the backend every 30 seconds. A completed plan normally shows up moments after it ends.
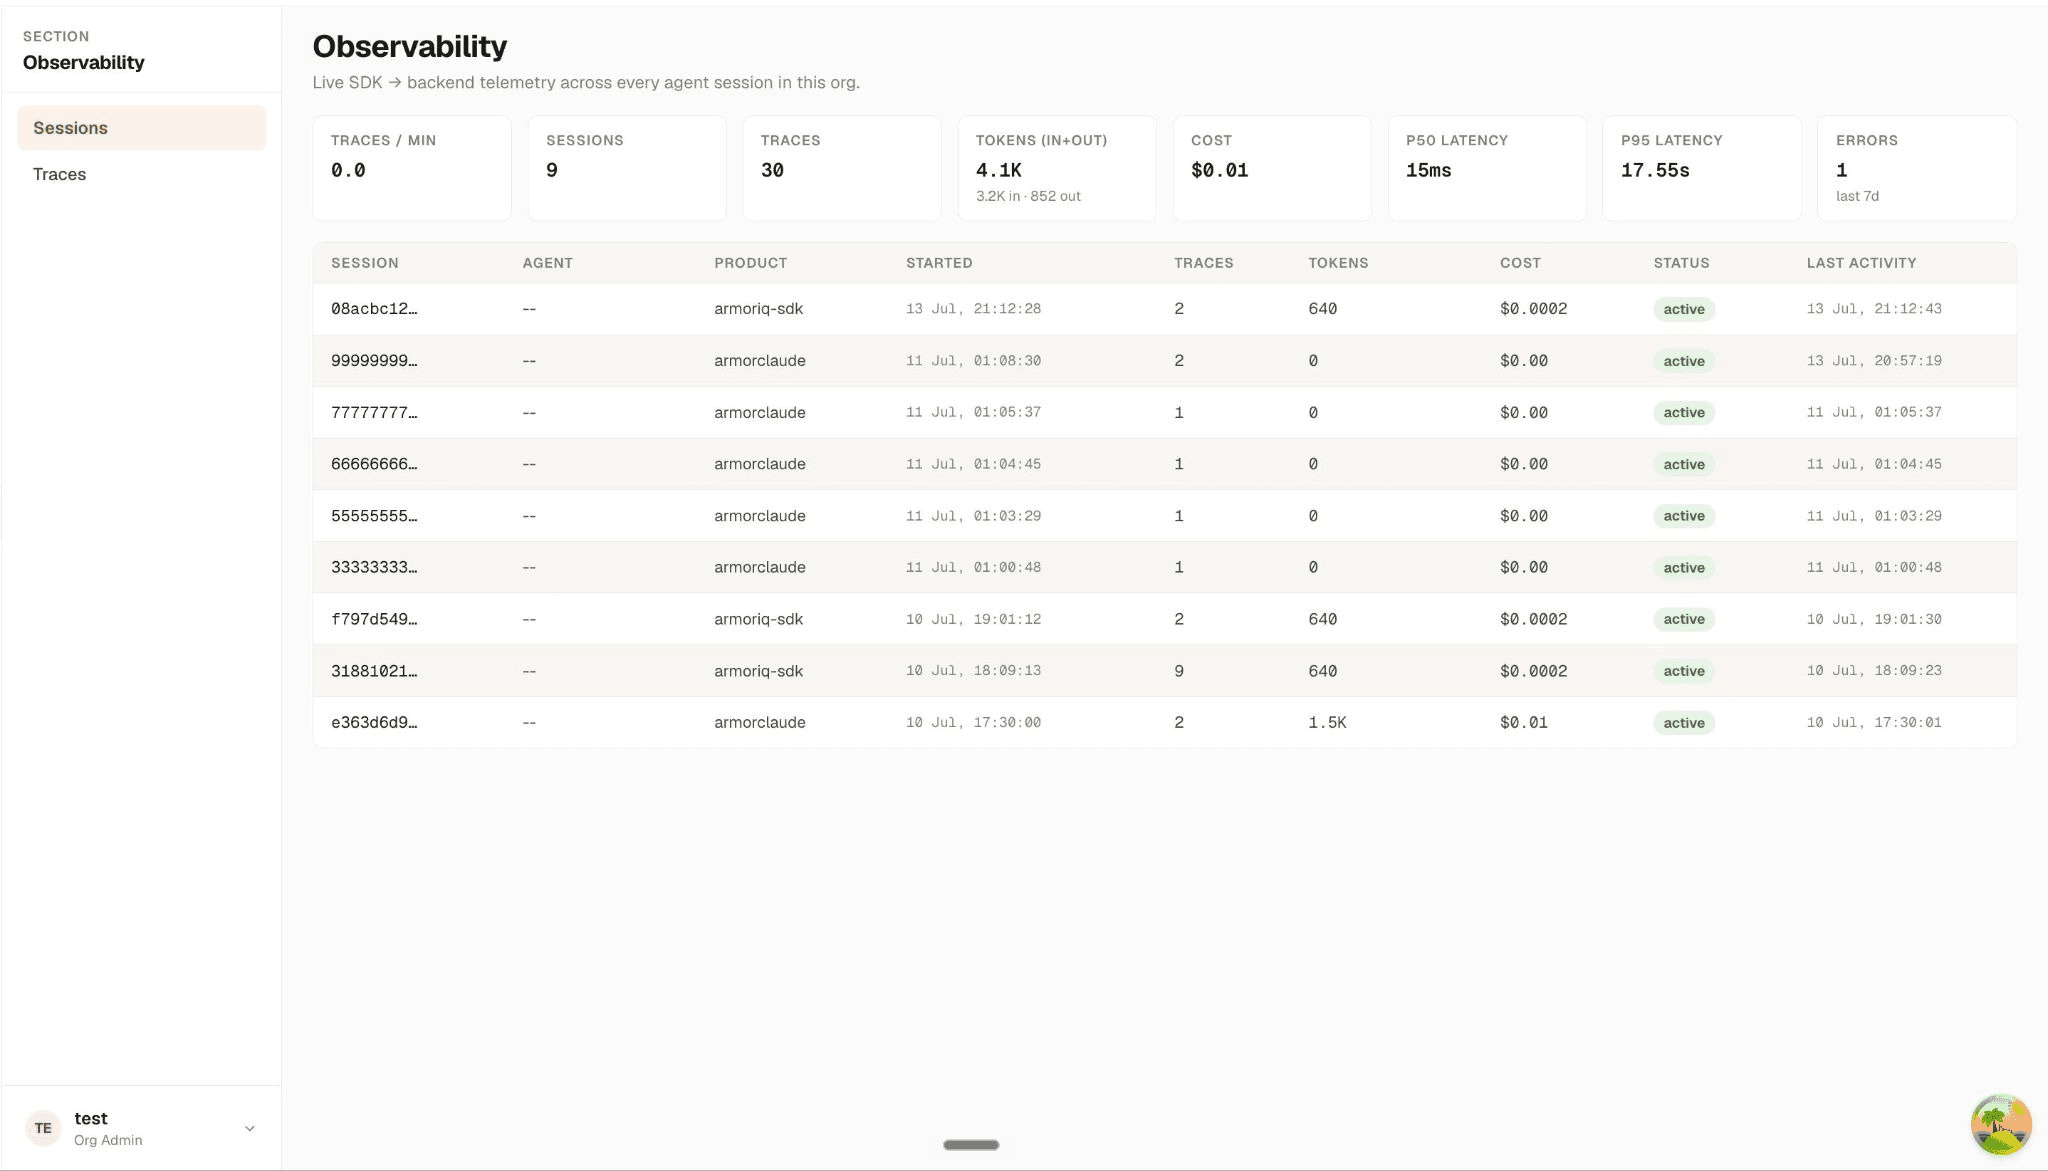
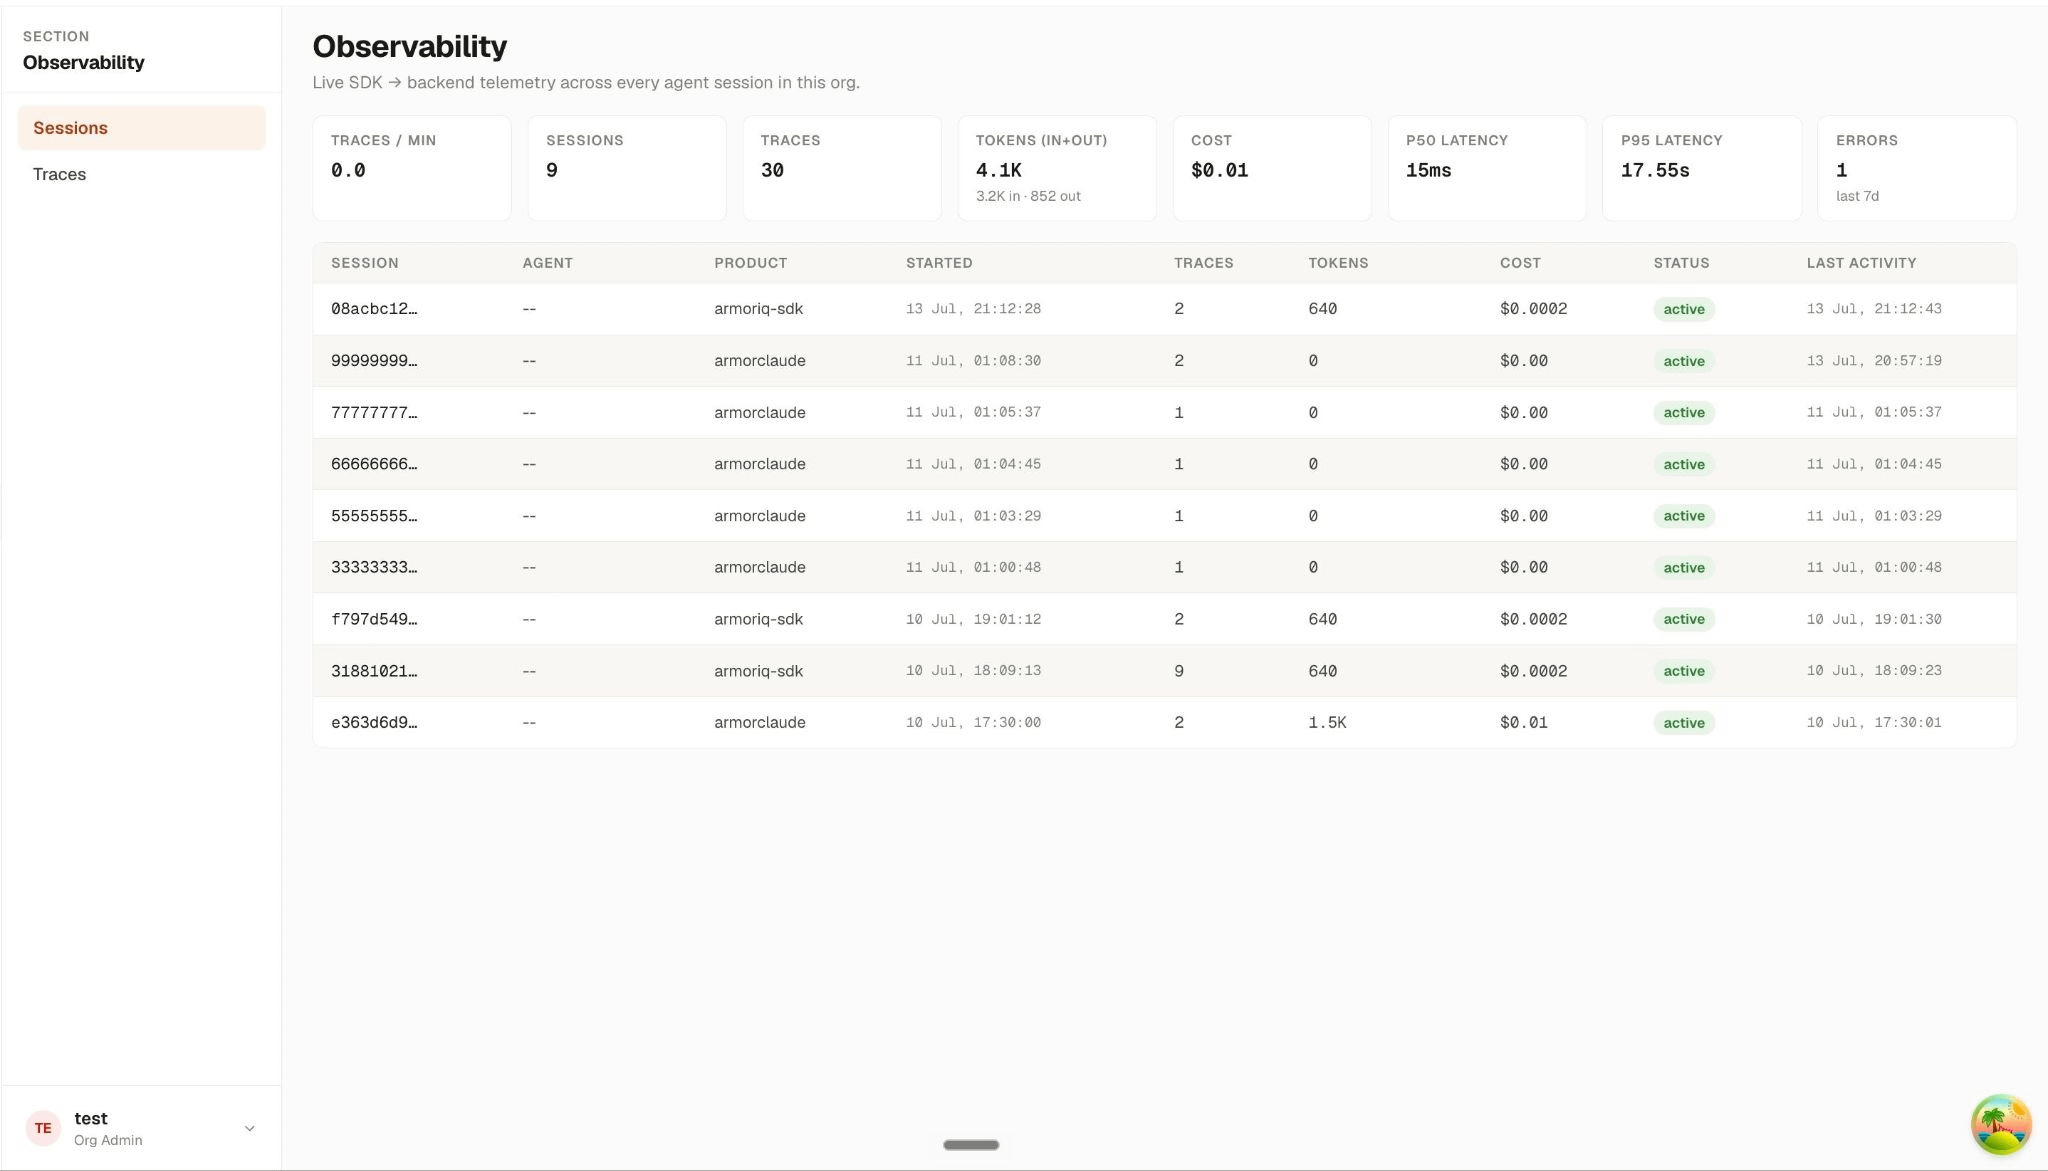
The Observability overview: org-wide KPIs with recent sessions below.
One investigation, end to end
Here is a real trace from a test organization. An ArmorClaude session runs the plan “Find and export Acme contacts.” The trace is named iap.plan, finishes ok in 17.55 seconds, and carries seven spans, two of them flagged.
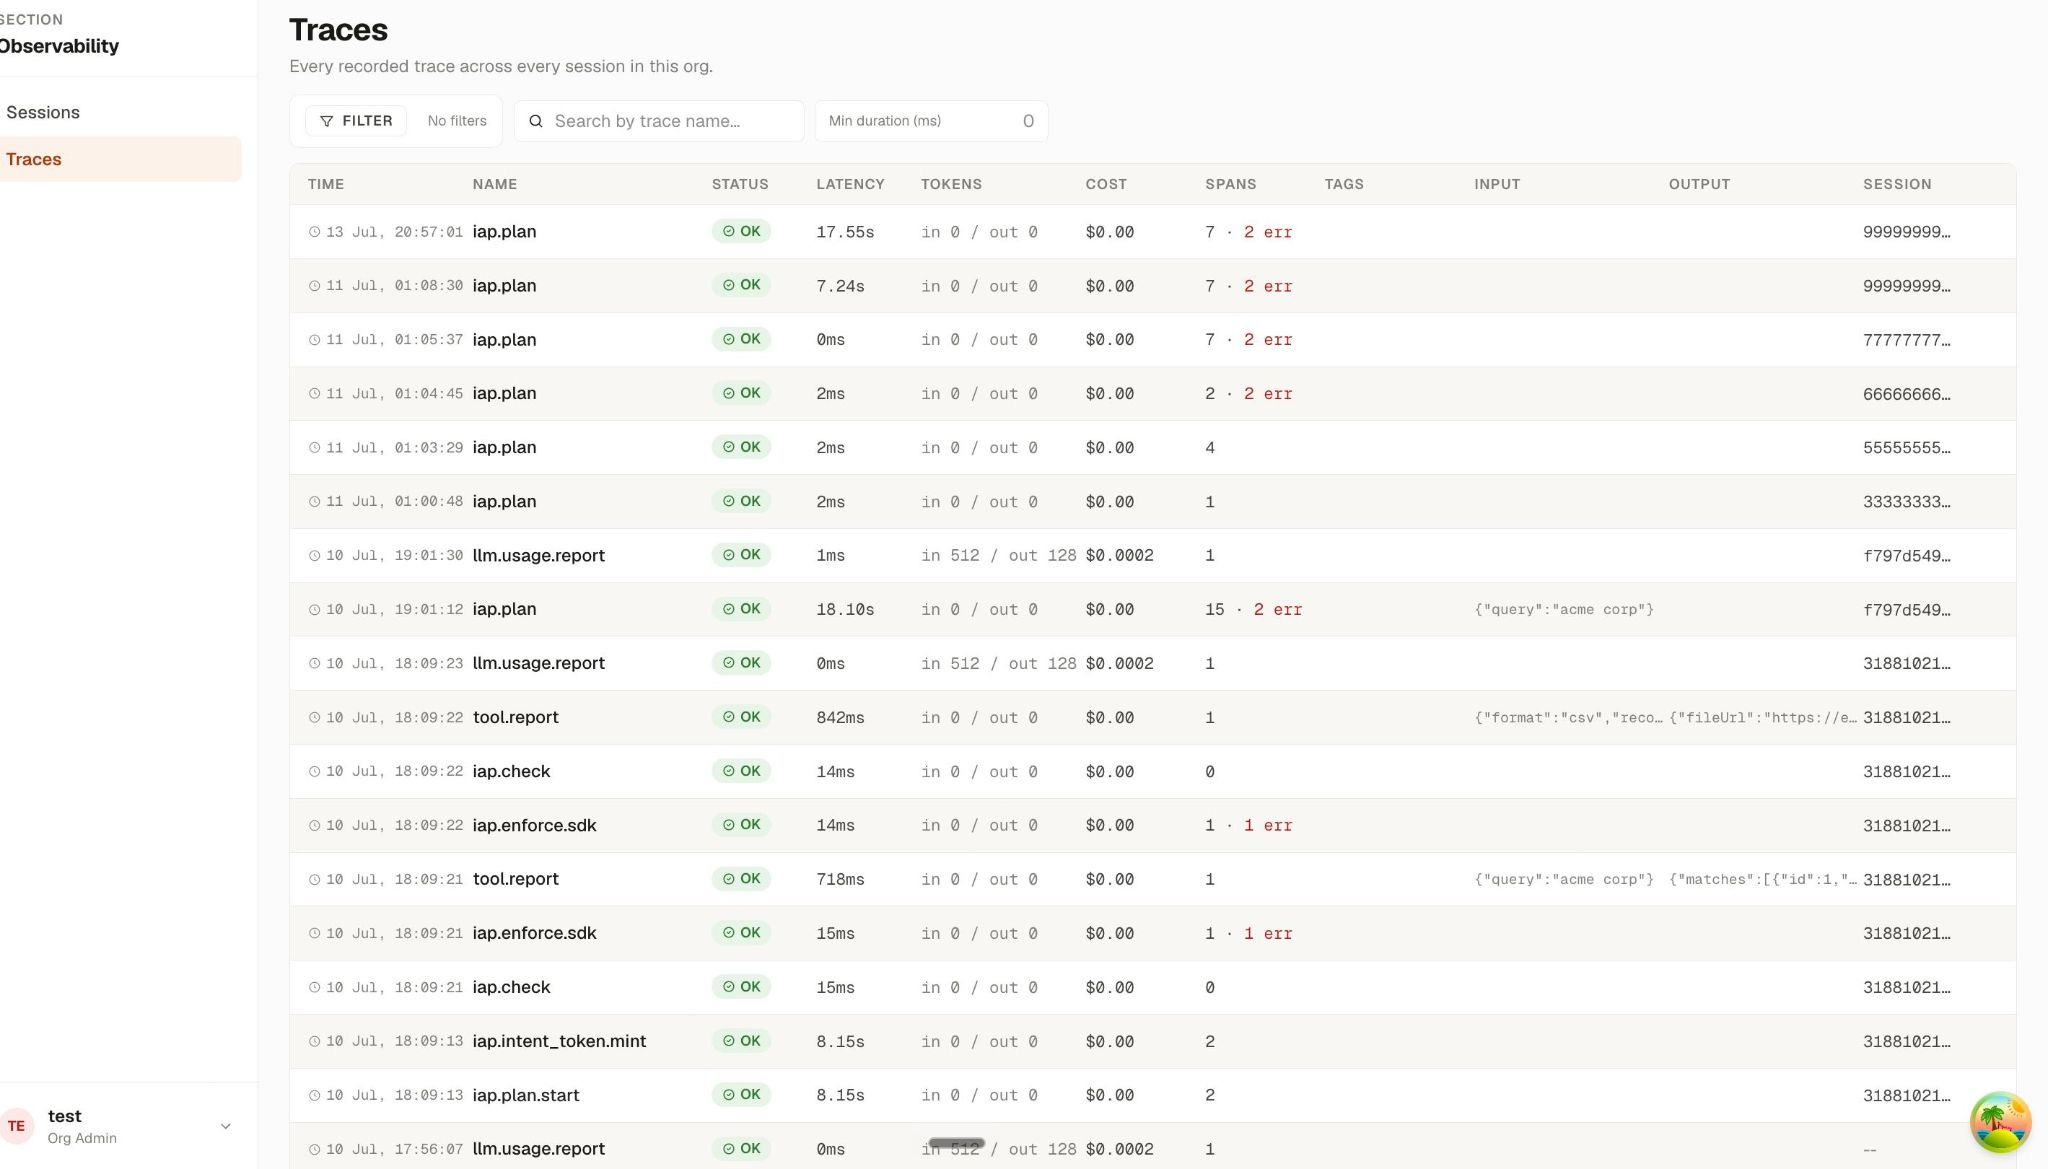
You start broad. The overview shows the org’s traffic, latency, and error count; the Traces view lists every recorded plan with status, latency, span count, and input/output previews. The flagged trace is one click away.
The Traces view: every recorded plan with status, latency, span counts, and error flags.
Open it as a tree and the whole plan reads in execution order. First tool: an iap.check on search_contacts, its policy.allow child recording the decision, then a tool.report span holding the exact input {”query”: “acme”}. Second tool: an iap.check on export_records, and this one is denied. The policy.deny span states the reason verbatim: intent drift tool not in plan (export_records). The agent reached for a tool its approved plan never declared, and the record says so in one line.
The trace tree: search_contacts allowed, export_records denied for intent drift every decision a selectable span.
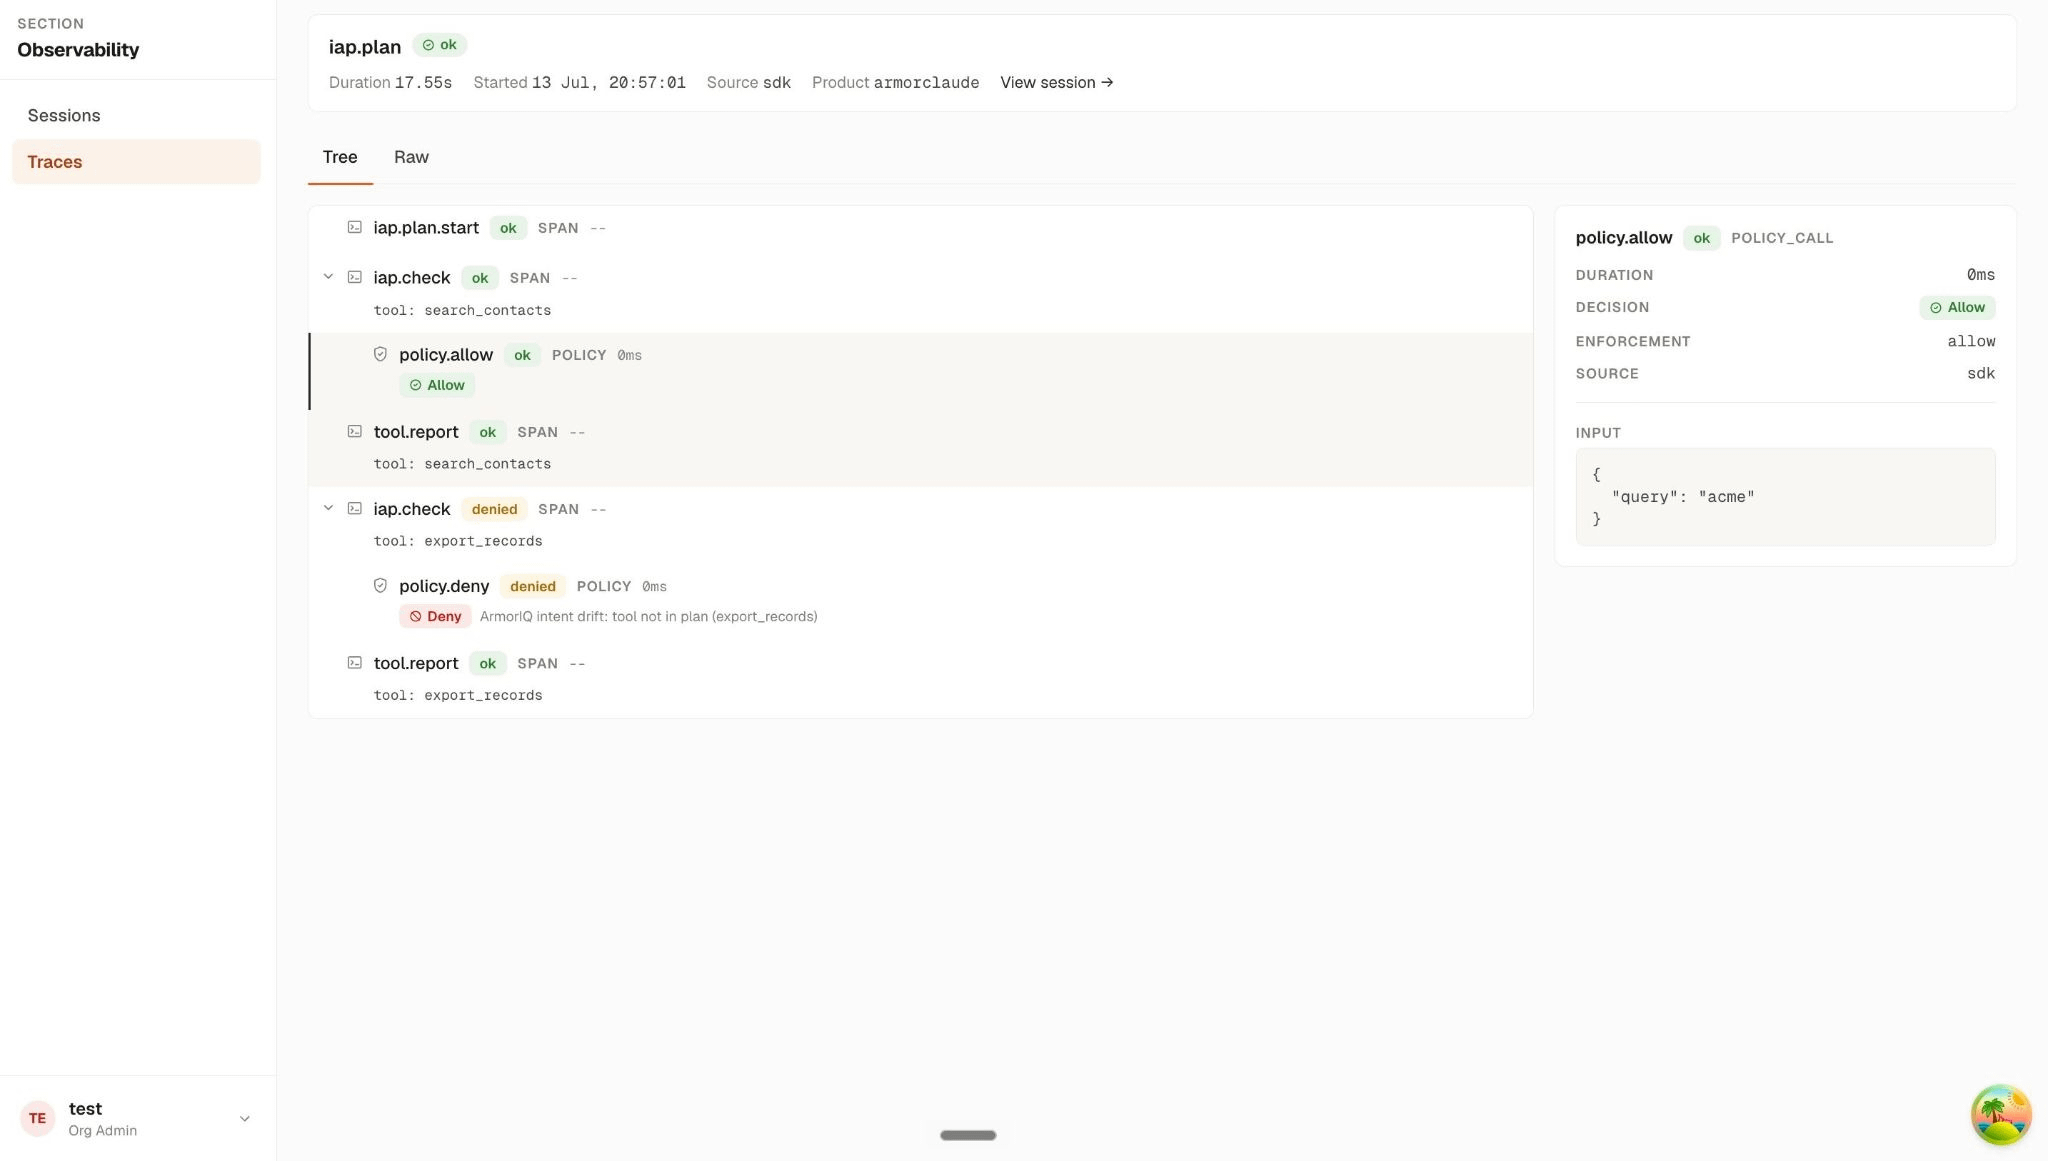
That one tree serves two readers. The developer asks what happened and gets the plan step, the tool input, and the result without touching a log file. The security owner asks why was this allowed, and why was that blocked and gets policy, decision, enforcement action, and reason on the span itself. When an agent action gets questioned in a review, the answer is a span you can point at. Nobody reconstructs it from three log systems after the fact.
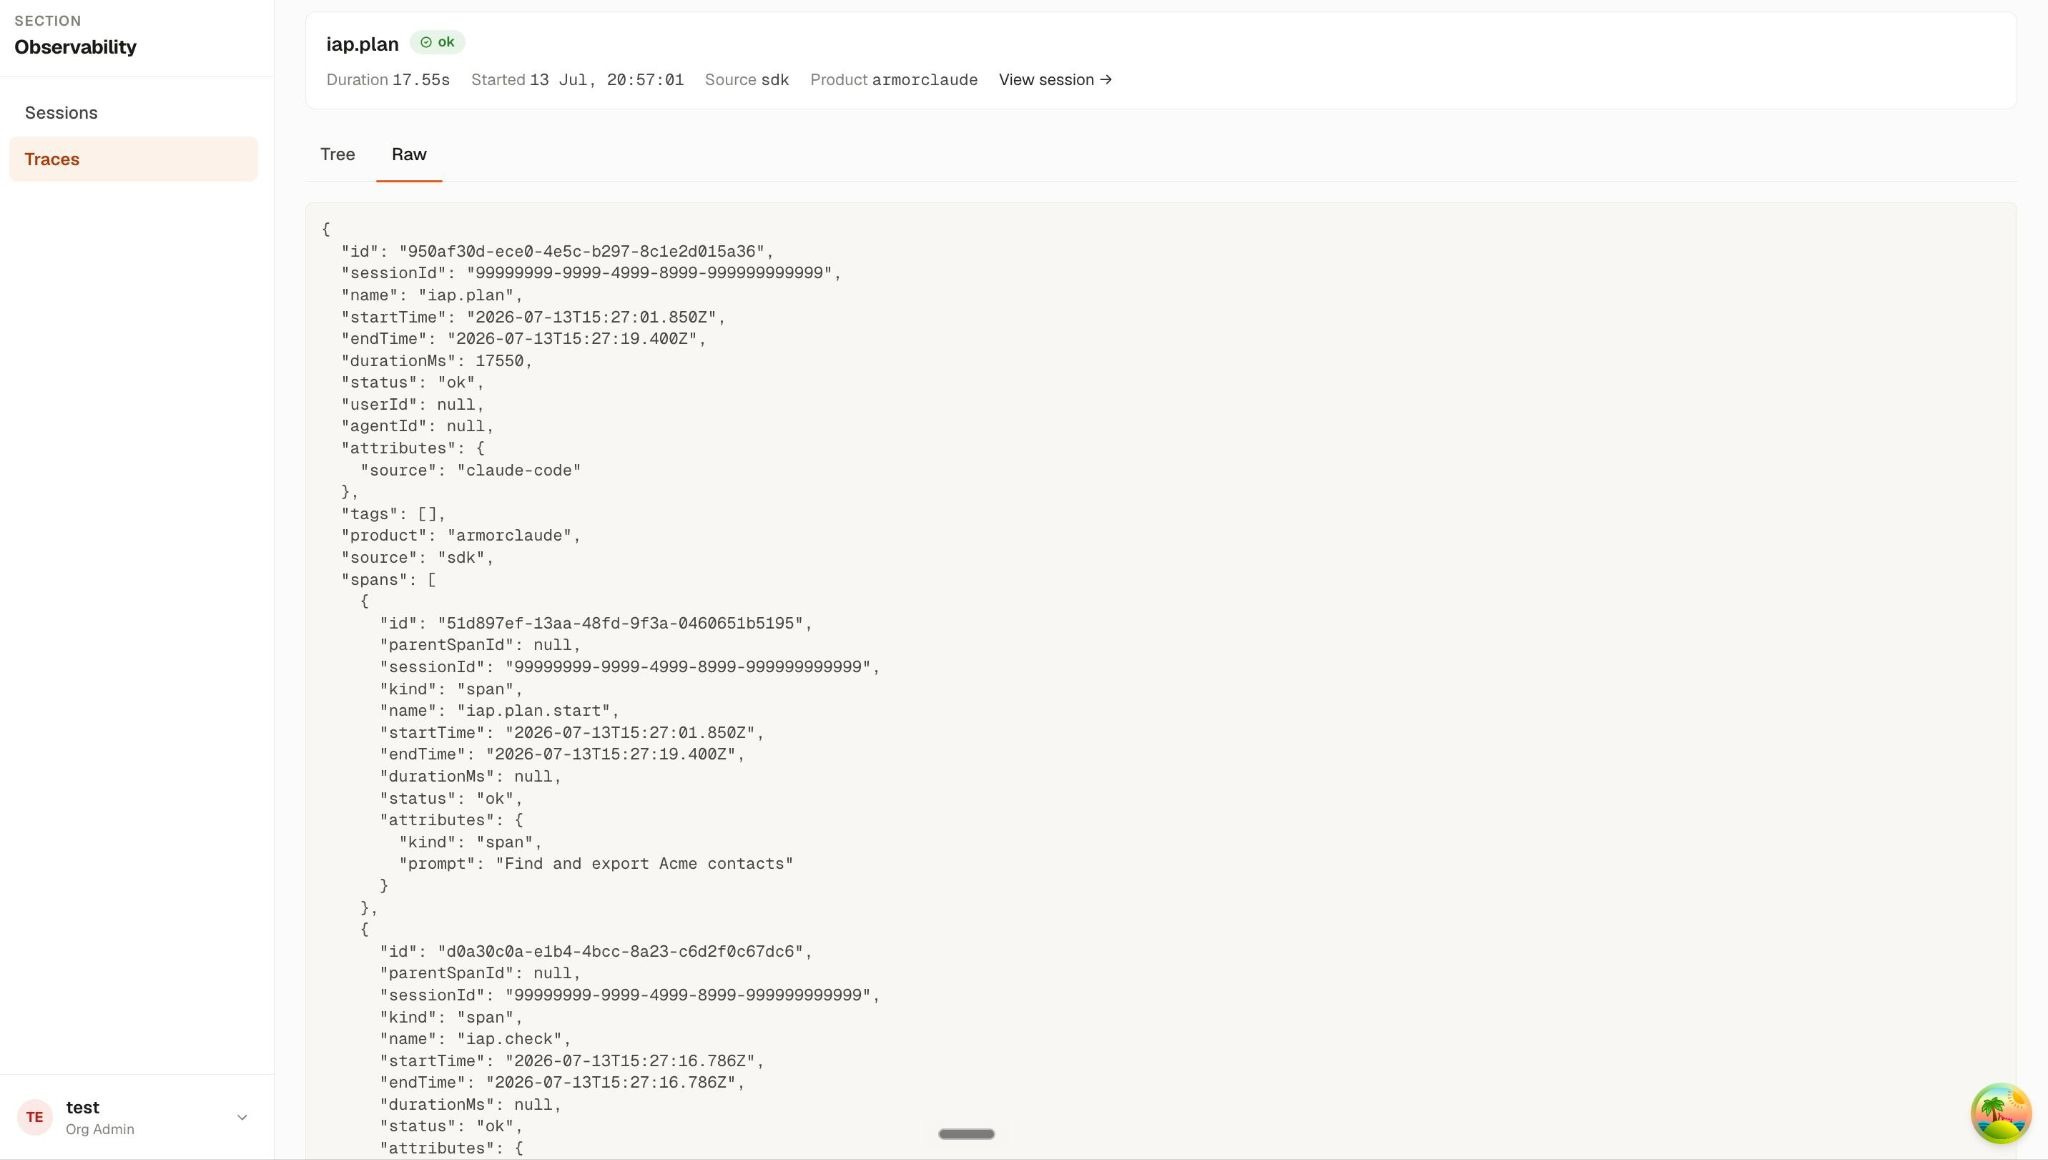
And when the tree isn’t enough, the Raw tab has the full trace as JSON every span, every attribute, including the plan prompt itself.
The Raw view: the complete trace payload, down to the plan prompt and per-span attributes.
What it is not
Four boundaries, stated plainly.
It is not streaming. Ended traces ship every 5 seconds and the UI polls every 30. Near-live, not live.
It is not a billing ledger. Cost comes from producer-reported values or a static price table, and tokens appear only when the integration reports model usage. A $0.00 can mean “usage not reported” or “price unknown” it does not mean the call was free. The raw trace tells you which.
It is not the policy engine. Enforcement decisions happen regardless of whether telemetry succeeds. Observability records the decision; it never makes one.
It is not OpenTelemetry. ArmorIQ uses its own trace and span schema, built around plans and policy decisions rather than generic HTTP spans.
The evidence chain
Any log can tell you an agent called a tool. The questions that matter come after: did the call match the plan, what authorized it, what did it cost, how did it end. ArmorIQ answers all four from one record: the plan, the policy decision, the tool result, the model usage, and the final status in a single trace, scoped to your organization.
That’s the evidence chain your logs were never going to give you.
Documentation :- https://docs.armoriq.ai/platform/observability